First dive into predictive modeling with a Kaggle competition. See my thought process, methods, failures, and sucesses.
As the capstone week of my second unit at Lambda School, our Data Science cohort competed against each other in a Kaggle style competition.
Given a dataset from DrivenData that has information from the Tanzanian Ministry of Water, we were asked to make a machine learning model that accurately predicts the functionality of water pumps from the study.

-
The Goal: Create a model to predict the functionality of Tanzanian wells.
-
The Sub-goal: Get an accuracy score above 80 and beat all the other nerds in my cohort (I say nerd lovingly, as I certainly am one of them.)
This being my first deep dive into machine learning, I was excited to get started. Using what I’d learned over the past few weeks, I knew I could create a model that would do well against my classmates. I had 4 full days to explore this data and experiment with different methods and predictive models. I will take you through the rollercoaster of successes and failures that occurred throughout the week.
Day 1
We get our data, and we’re off! I began by taking a look at the target that I would be trying to predict — status of water pumps.
If I were to make an initial model that predicts that every pump is functional, I would be correct about 54% of the time. Functional: 0.543 Non-functional: 0.384 Functional Needs Repair: 0.072
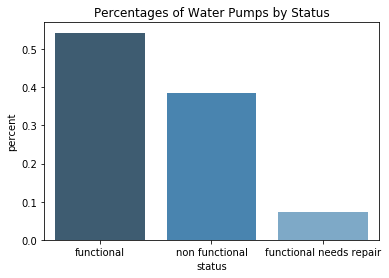
A 54% accuracy score is a start, but I know I can improve from here. After a quick glance at the data, I saw that a lot of columns have non-numeric data. It would take time to explore, clean, and encode this into numeric data before it is usable. I would like to make fast progress, so I elected to skip this step for now. I created a Linear Regression model using only the numeric columns, and got an accuracy score of 59%.
I am curious about the correlation between these features, so I took a deeper look using a heat map.
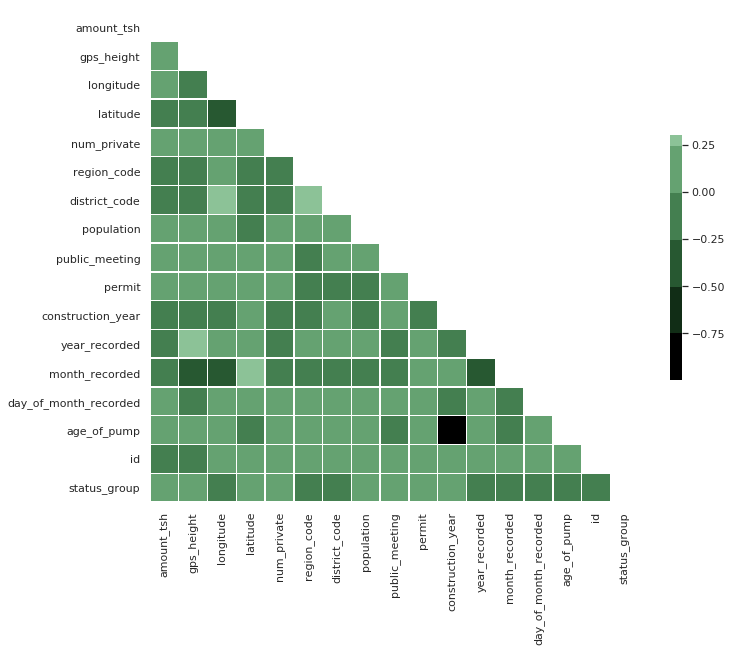
My target feature — “status_group” — does not appear to have a strong correlation with any of the numeric features. This leads me to my next task: getting all of the categorical data in usable format to add to my model.
Day 2
Up until this point, I haven’t spent any time cleaning or dealing with null values in this data. It was a tedious process, but I was sure the work I was doing would improve my model. I spent most of the second day combing through each column of data, figuring out the best way to deal with null values, and learning about different methods for encoding my data.
I did some feature engineering, and created a category called “age_of_pump” using the construction date and the year the pump had most recently been recorded. This turned out to be one of my most important features.
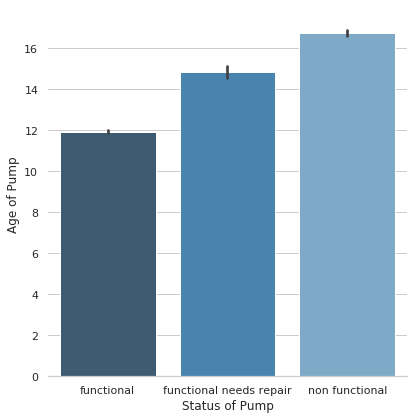
After a full day of cleaning, feature engineering, and encoding, I re-ran my model and improved my accuracy score by… about 6%.
Day 3
Okay, time was becoming limited, and I started to wonder if all the tedious work I did would even matter. I began day 3 using a Gradient Boosting Classifier. I knew from experience that this model tends to do quite well, especially in Kaggle competitions. I ran a simple xgboost classifier on all of my cleaned data. 77%! Respectable score, and I can take a deep breath before continuing to improve.
There are about 40 features that were used to train my model, and I wanted to see if they are all contributing to the outcome. I ran a feature importances test on my most recent model, then looked at the top 15 features.
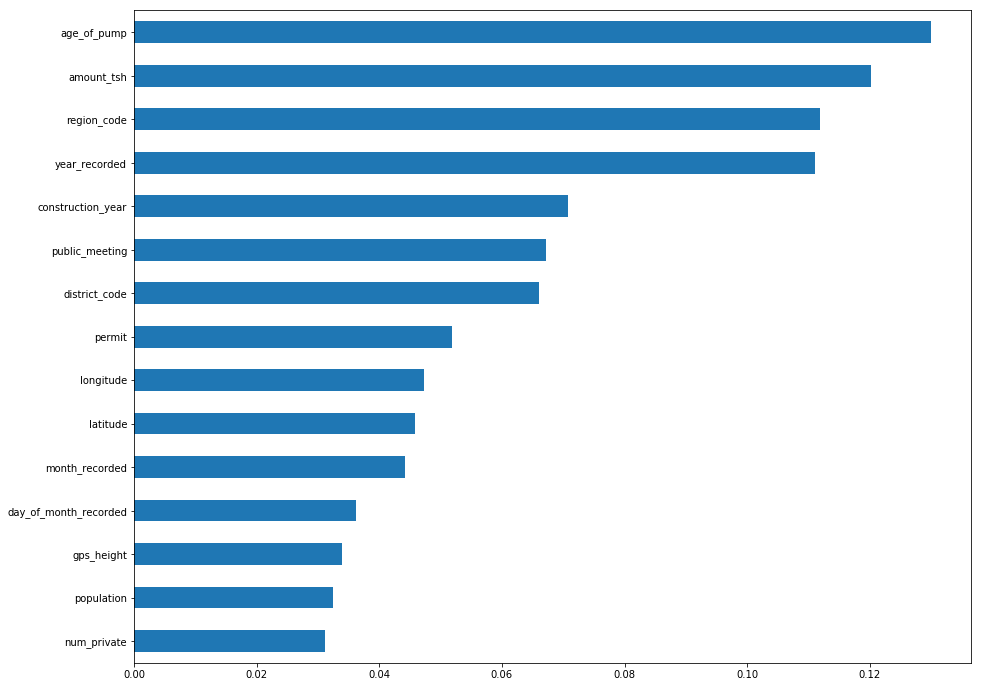
Using that knowledge, I continue to upgrade my model. I choose 8 of what I think are the most important features and run another model. 78%
Day 4
This is what I like to call iteration day. I used my XGBClassifier, and tweaked things until there was nothing else to try. I ran probably 2 dozen models and changed one small item until I ran out of time (and patience.)
Model 1 — 8 features, simple imputer, standard scaler: 78%
Model 2 — 8 features, simple imputer, no scaler: 78%
Model 3 — 8 features, tweaked parameters of simple imputer, standard scaler: 78%
Model 4 — 8 features, simple imputer, robust scaler: 79%
Model 5 — 9 features, simple imputer, standard scaler: 79%
And on and on and on I went. I finally breached an accuracy score of 80, but I won’t go into detail how I got there. If you want to see the work behind my week, you can take a look at the code from my github repository here.
Things I learned
- Simple is (mostly) better
- Domain knowledge is an important part of understanding relationships in data.
- Cleaning your data can make a substantial difference.
- Iteration can be a productive method if you have the time.
Click here to view this post on Medium.